Traders all over the world use different tools at their disposal to try and predict the direction in which the market will move. Usually, these versatile tools contain different pieces of information you have to put together in order to get an accurate prediction.
This is why it’s important to utilize tools encompassing multiple bits of information so it’s easier to keep track. This is where candlestick charts come in handy.
Keep reading to find out what candlestick charts are and how to read candlesticks for successful trading.
What Is a Candlestick Chart?
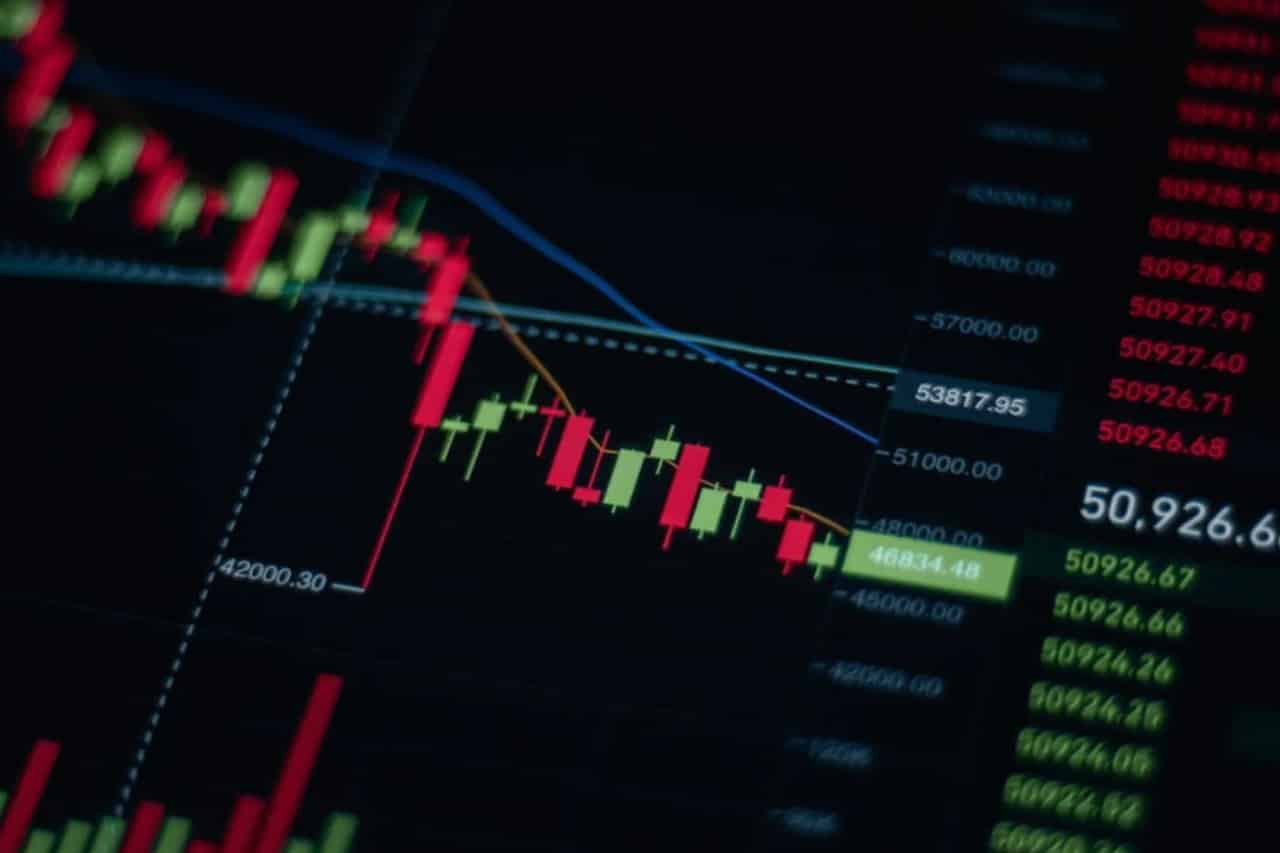
Candlestick charts graphically represent price movement using different colors to predict possible fluctuations based on past patterns.
Furthermore, candlestick patterns pack data from multiple time frames into single price bars, which makes them more convenient and information-packed than your traditional OHLC (open, high, low, close) bars.
This type of market prediction has been used for centuries. It dates back to the 1700s when Muhenisa Homma, a Japanese rice trader, noticed a significant link between the supply and demand of rice and the emotions of traders.
This kind of chart was developed 100 years before the West developed the bar and point-and-figure charts and is a powerful tool used to predict the market even today.
Because candlestick charts encompass a wide array of data, price points, and news, they’re best used daily, making them a really useful research tool for both long-term and swing traders.
How to Read a Candlestick Chart?
We’ve already established what a powerful tool candlestick charts can be, but it brings us to the most important question: how do you actually read them?
Reading a candlestick chart is pretty straightforward once you get the hang of it. A daily candlestick represents the market’s OHLC prices (opening, high, low, and closing).
The body of a candlestick, called a real body, represents an asset’s open and close price. The price can be bullish or bearish, depending on where the candlestick is located. For example, the close will be above an open in a bullish market, and vice versa.
The real body is colored with either red or black to indicate a drop in price or green or white for a price increase.
The lines above and below the real body (often called wicks or shadows) represent the maximum daily high and low.
Usually, you’ll find two shadows, but this doesn’t always have to be the case. The upper shadow stands for the peak price point reached, while the lower shadow represents the lowest.
When you take these factors into consideration, these candlestick parts can signal changes in the direction in which the market is moving. To confirm these predictions, simply look at the candlestick chart again the following day.
5 Basic Types of Candlesticks
Now that we have familiarized ourselves with the basic candlestick model, it’s time to delve deeper into some candlestick patterns that can accurately predict price directions and potential reversals.
Candlestick patterns work in the context of the surrounding price bars and consequently predict higher and lower prices.
However, keep in mind candlestick patterns work only in the time frame in which the chart is being reviewed, whether it be daily, weekly, or monthly. It’s also important to note their potency decreases three to five bars after the pattern has been completed.
Doji
If you have a candlestick formation where the open and close are (nearly) identical, then this is called a doji. A doji points to indecision in the market when you’ll find buyers and sellers at a standstill.
But a doji is highly important as it indicates a new price point is about to arise as the indecision of the buyers and sellers disappears.
Falling Three Method
This pattern consists of five candles which indicate the continuation of a downtrend. It’s made of a long red body followed by three small green bodies and then another long red body.
The green candles are covered by bearish reds, indicating that bulls can’t reverse the downtrend.
Rising Three Method
The Rising Three method is the next candlestick chart to be explained. This pattern indicates an uptrend and comprises a long green body followed by three small red bodies followed by another long green.
Hammer
A hammer pattern is characterized by a long lower shadow or wick, meaning a down move is ending (think of it as hammering out the bottom). Basically, the bulls resisted the pressure to sell, and they pushed the price back up.
When you see a hammer pattern in the candlestick stock chart, it suggests a change in directional sentiment and is confirmed by a bullish candle the next day.
Hanging Man
The Hanging man formation follows the bullish hammer location and suggests a potential reversal lower. It’s formed with a green or red candlestick with a short body and a long lower shadow.
This formation suggests that selling interest has entered the market, which has led to the long tail to the downside and marks the end of an uptrade.
These are just some of the most important candlestick patterns, and you’ll run into many more the more you get into it. To get started, it’s important to analyze whether a pattern is bullish, bearish, or neutral.
Extra Tips on Reading Candlesticks
While keeping track of candlestick charts can get annoying over time, if you notice a pattern, you’ll have a basis for taking a trade — just make sure you don’t fall into the trap of seeing patterns where there are none.
Another useful tip is to keep an eye on long tails and small bodies. If you see small bodies (as in the case of a doji), buyers and sellers are fighting to a draw. In these cases, there is indecision in the marketplace.
It’s in times like these when it’s wise to sit back and watch how the prices will behave because either the bulls or the bears will have to win eventually.
It’s equally important to look out for long tails, particularly when combined with small bodies. Long tails indicate that buyers or sellers couldn’t push the price in their desired direction, in which case the price returns to near the open.
In the end, as long as you follow the rules and wait for confirmation of the pattern in the next day’s candle, you’ll find these patterns effective.
Candlestick Charts vs. Bar Charts
If you’re familiar with trading, you’ve probably already run into bar charts too. This might leave you wondering why you would need to familiarize yourself with candlestick chart patterns. In reality, bar charts and candlesticks show the same bits of information, just in a different way.
However, candlestick charts are more visual, considering the price bars are color-coded and real bodies are thicker, easily highlighting the difference between the open and the close.
In reality, it all comes down to preference. Some traders prefer the details and thickness of the real bodies that the candlestick chart has, while others prefer the clean-cut look of bar charts.
Either way, it won’t hurt to be acquainted with both types for some extra reassurance.
Conclusion
Your basic introduction to the world of candlestick charts and their significance is all laid out for you. The charts are a powerful form of technical analysis that can really help you polish your trading with only a little bit of patience and attention to detail.
Just keep in mind you should always wait for a next-day confirmation of the pattern before you make a trade based on it.
FAQs
Which candlestick pattern is bullish?
Some popular bullish candlestick patterns include The Hammer, meaning the stock is nearing the bottom in a downtrend, and the Inverted Hammer signaling a likely trend reversal.
Other bullish candlestick patterns are The Morning Star, Three White Soldiers, and The Piercing Line.
How do you read candlesticks for beginners?
Each candlestick represents a specific time frame and gives data about the price’s open, high, low, and close during the set period.
Your standard candlestick is made of a body that extends from the closing price to the opening price of an asset. The upper wick shows the highest price reached during this period, while the lower wick starts from the lowest price seen during the same period.
If you want to learn how to read candlesticks, try and memorize the most important patterns so you’d recognize them and anticipate the next move.
You also need to know the meaning behind each bar and use them in combination with other pieces of information to confirm your predictions.